All posts by Frank
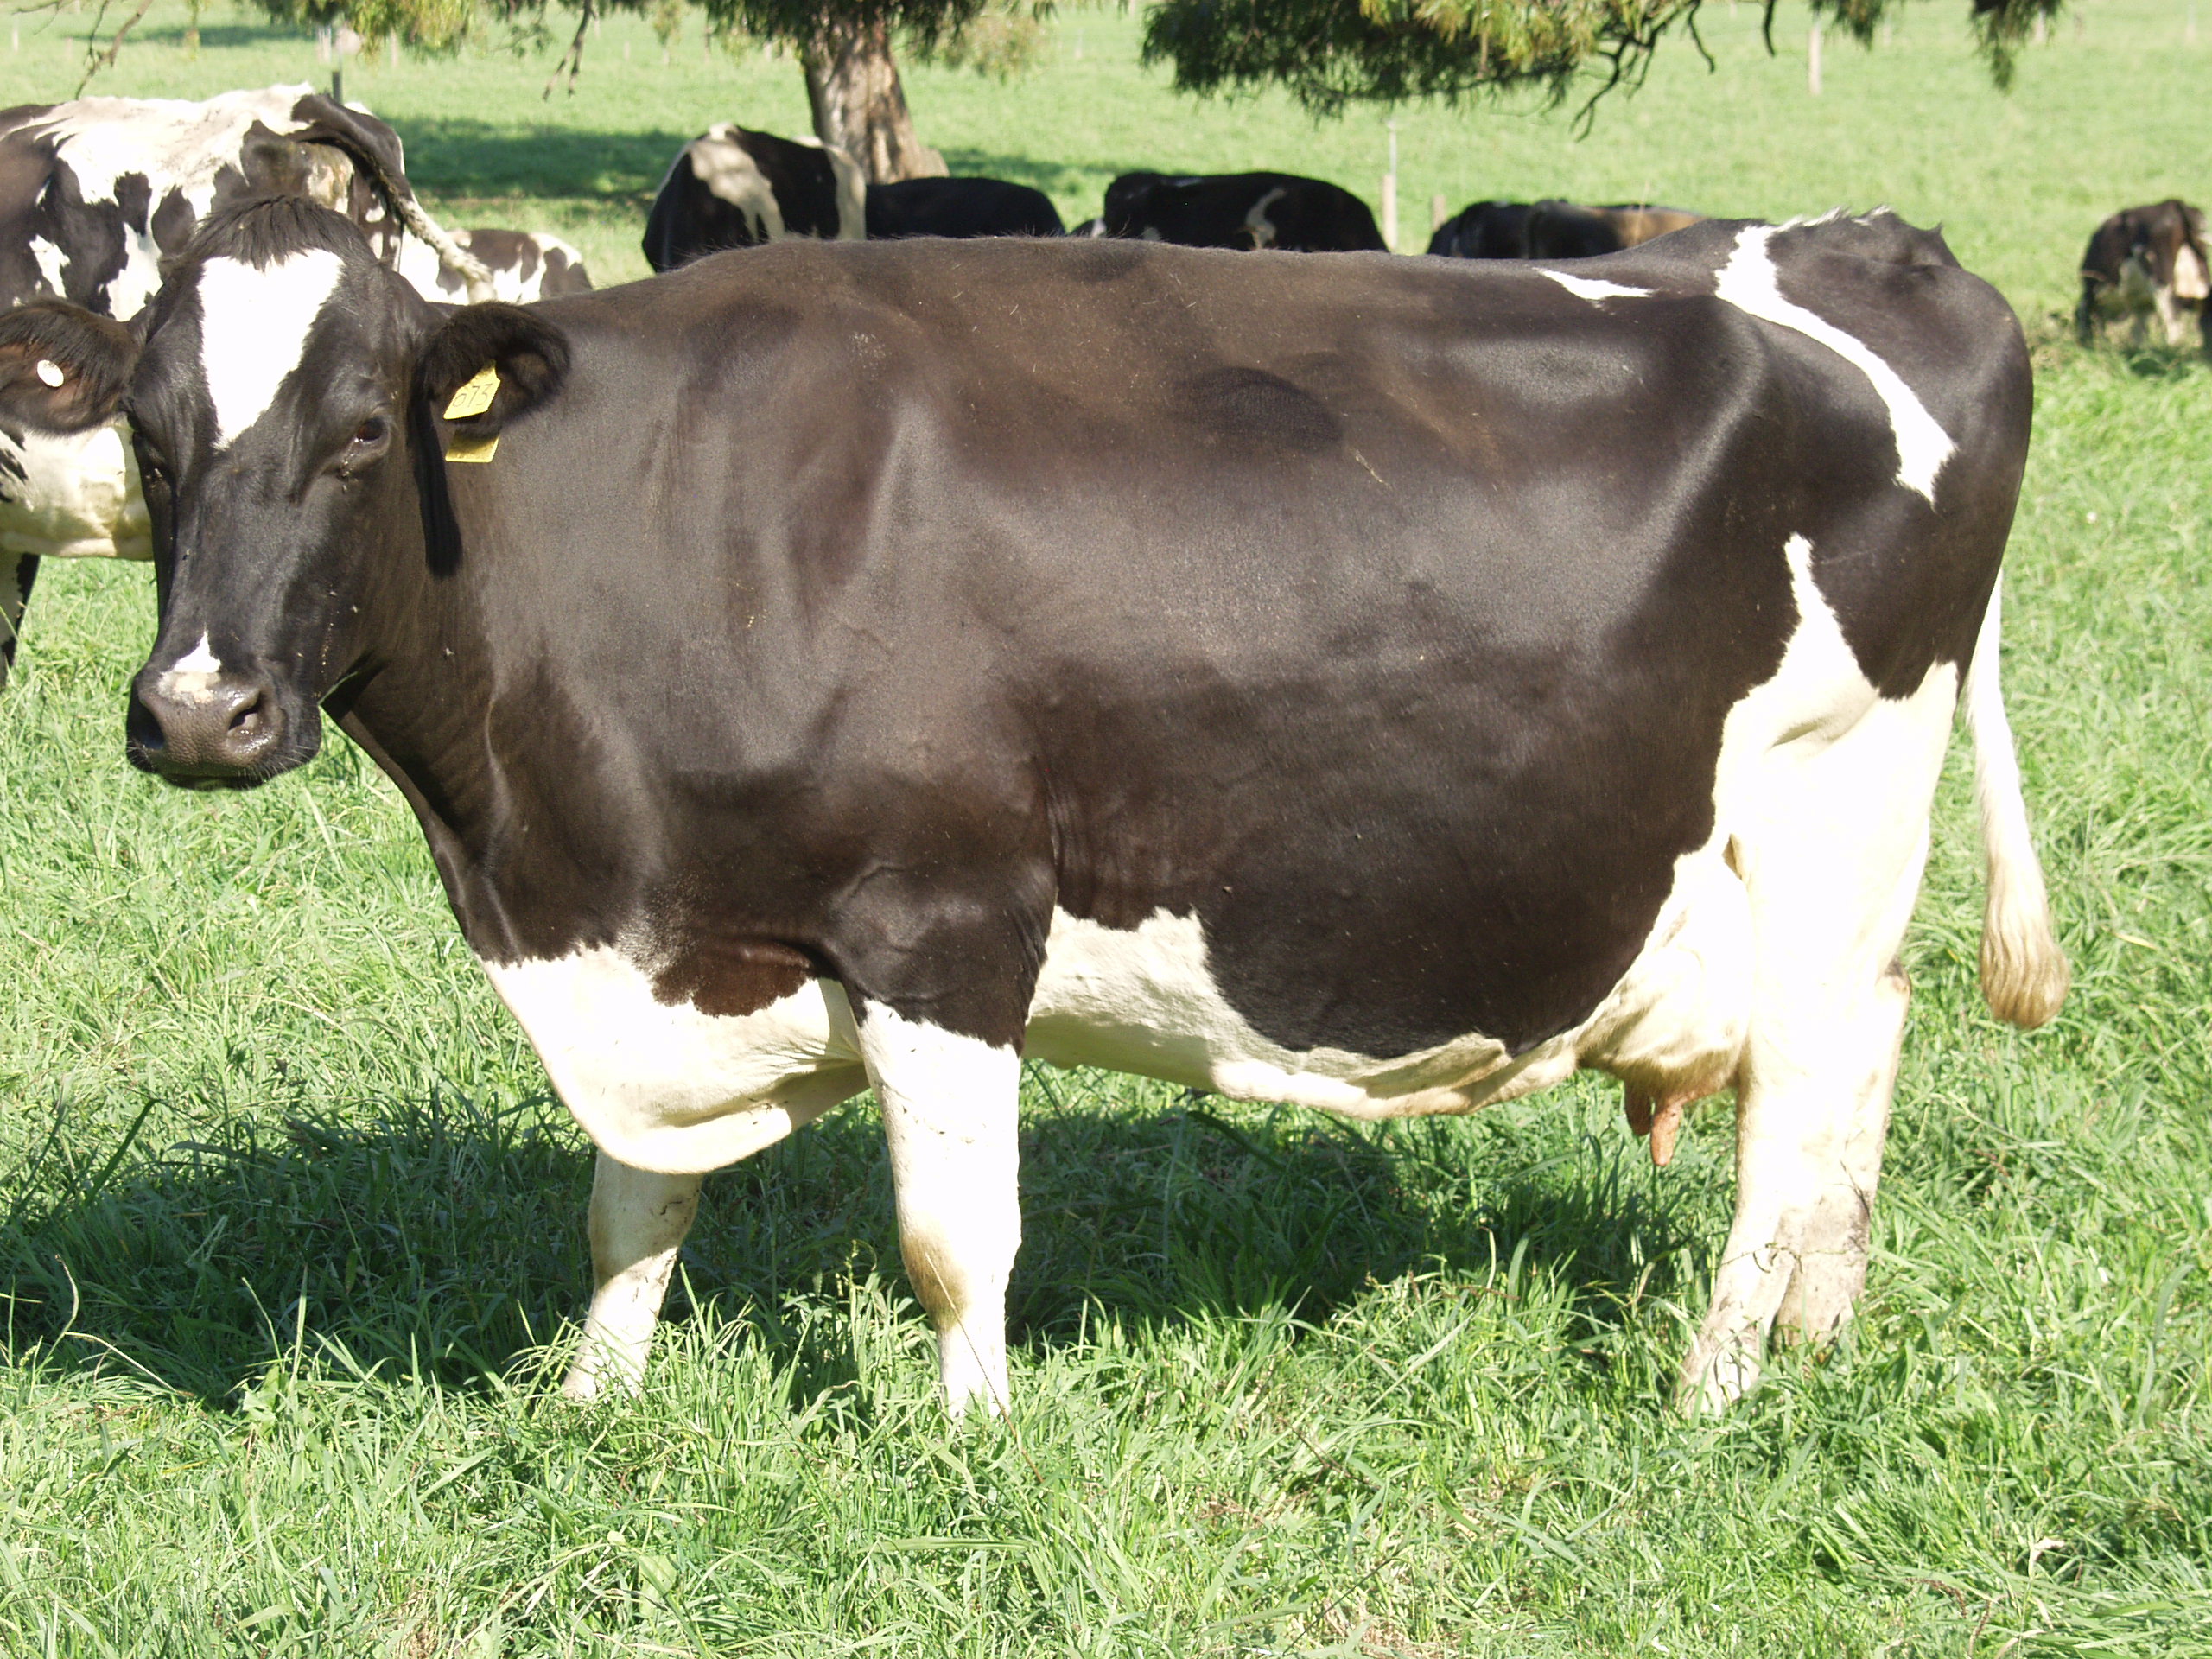
MDF Body condition score of cows
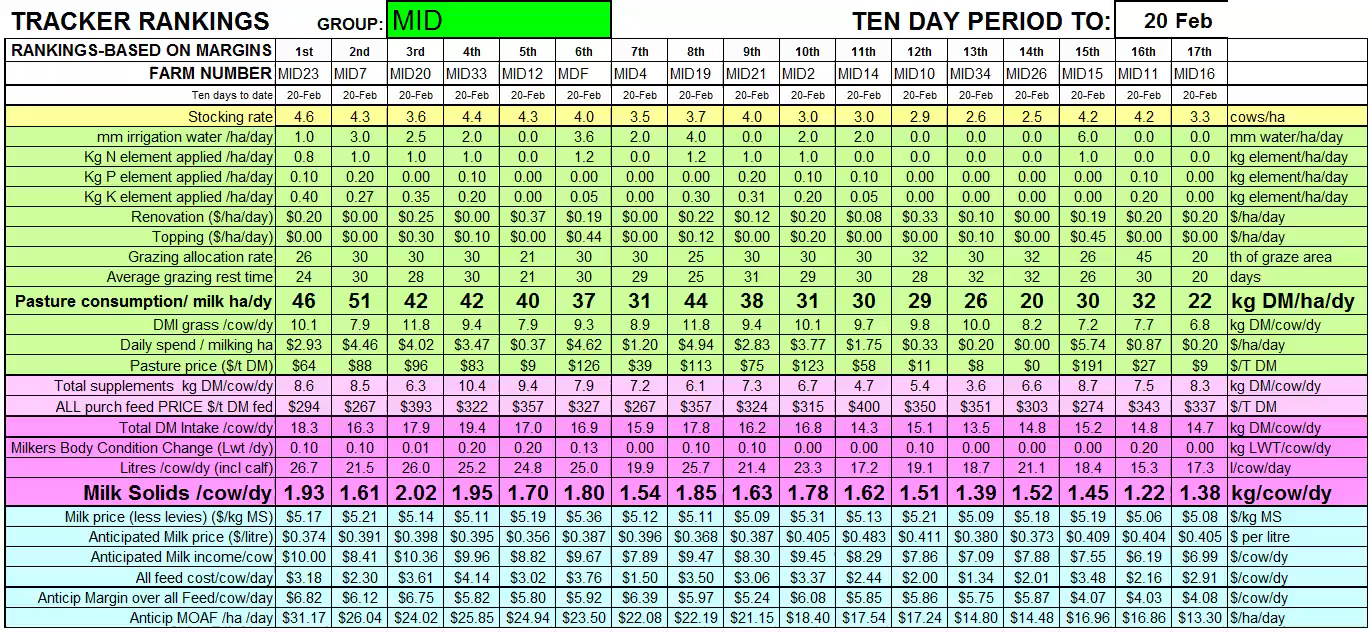
Tracker dairy feed margin analysis Feb 20 2012
MDF Virtual Farm walk Paddock 35 growth
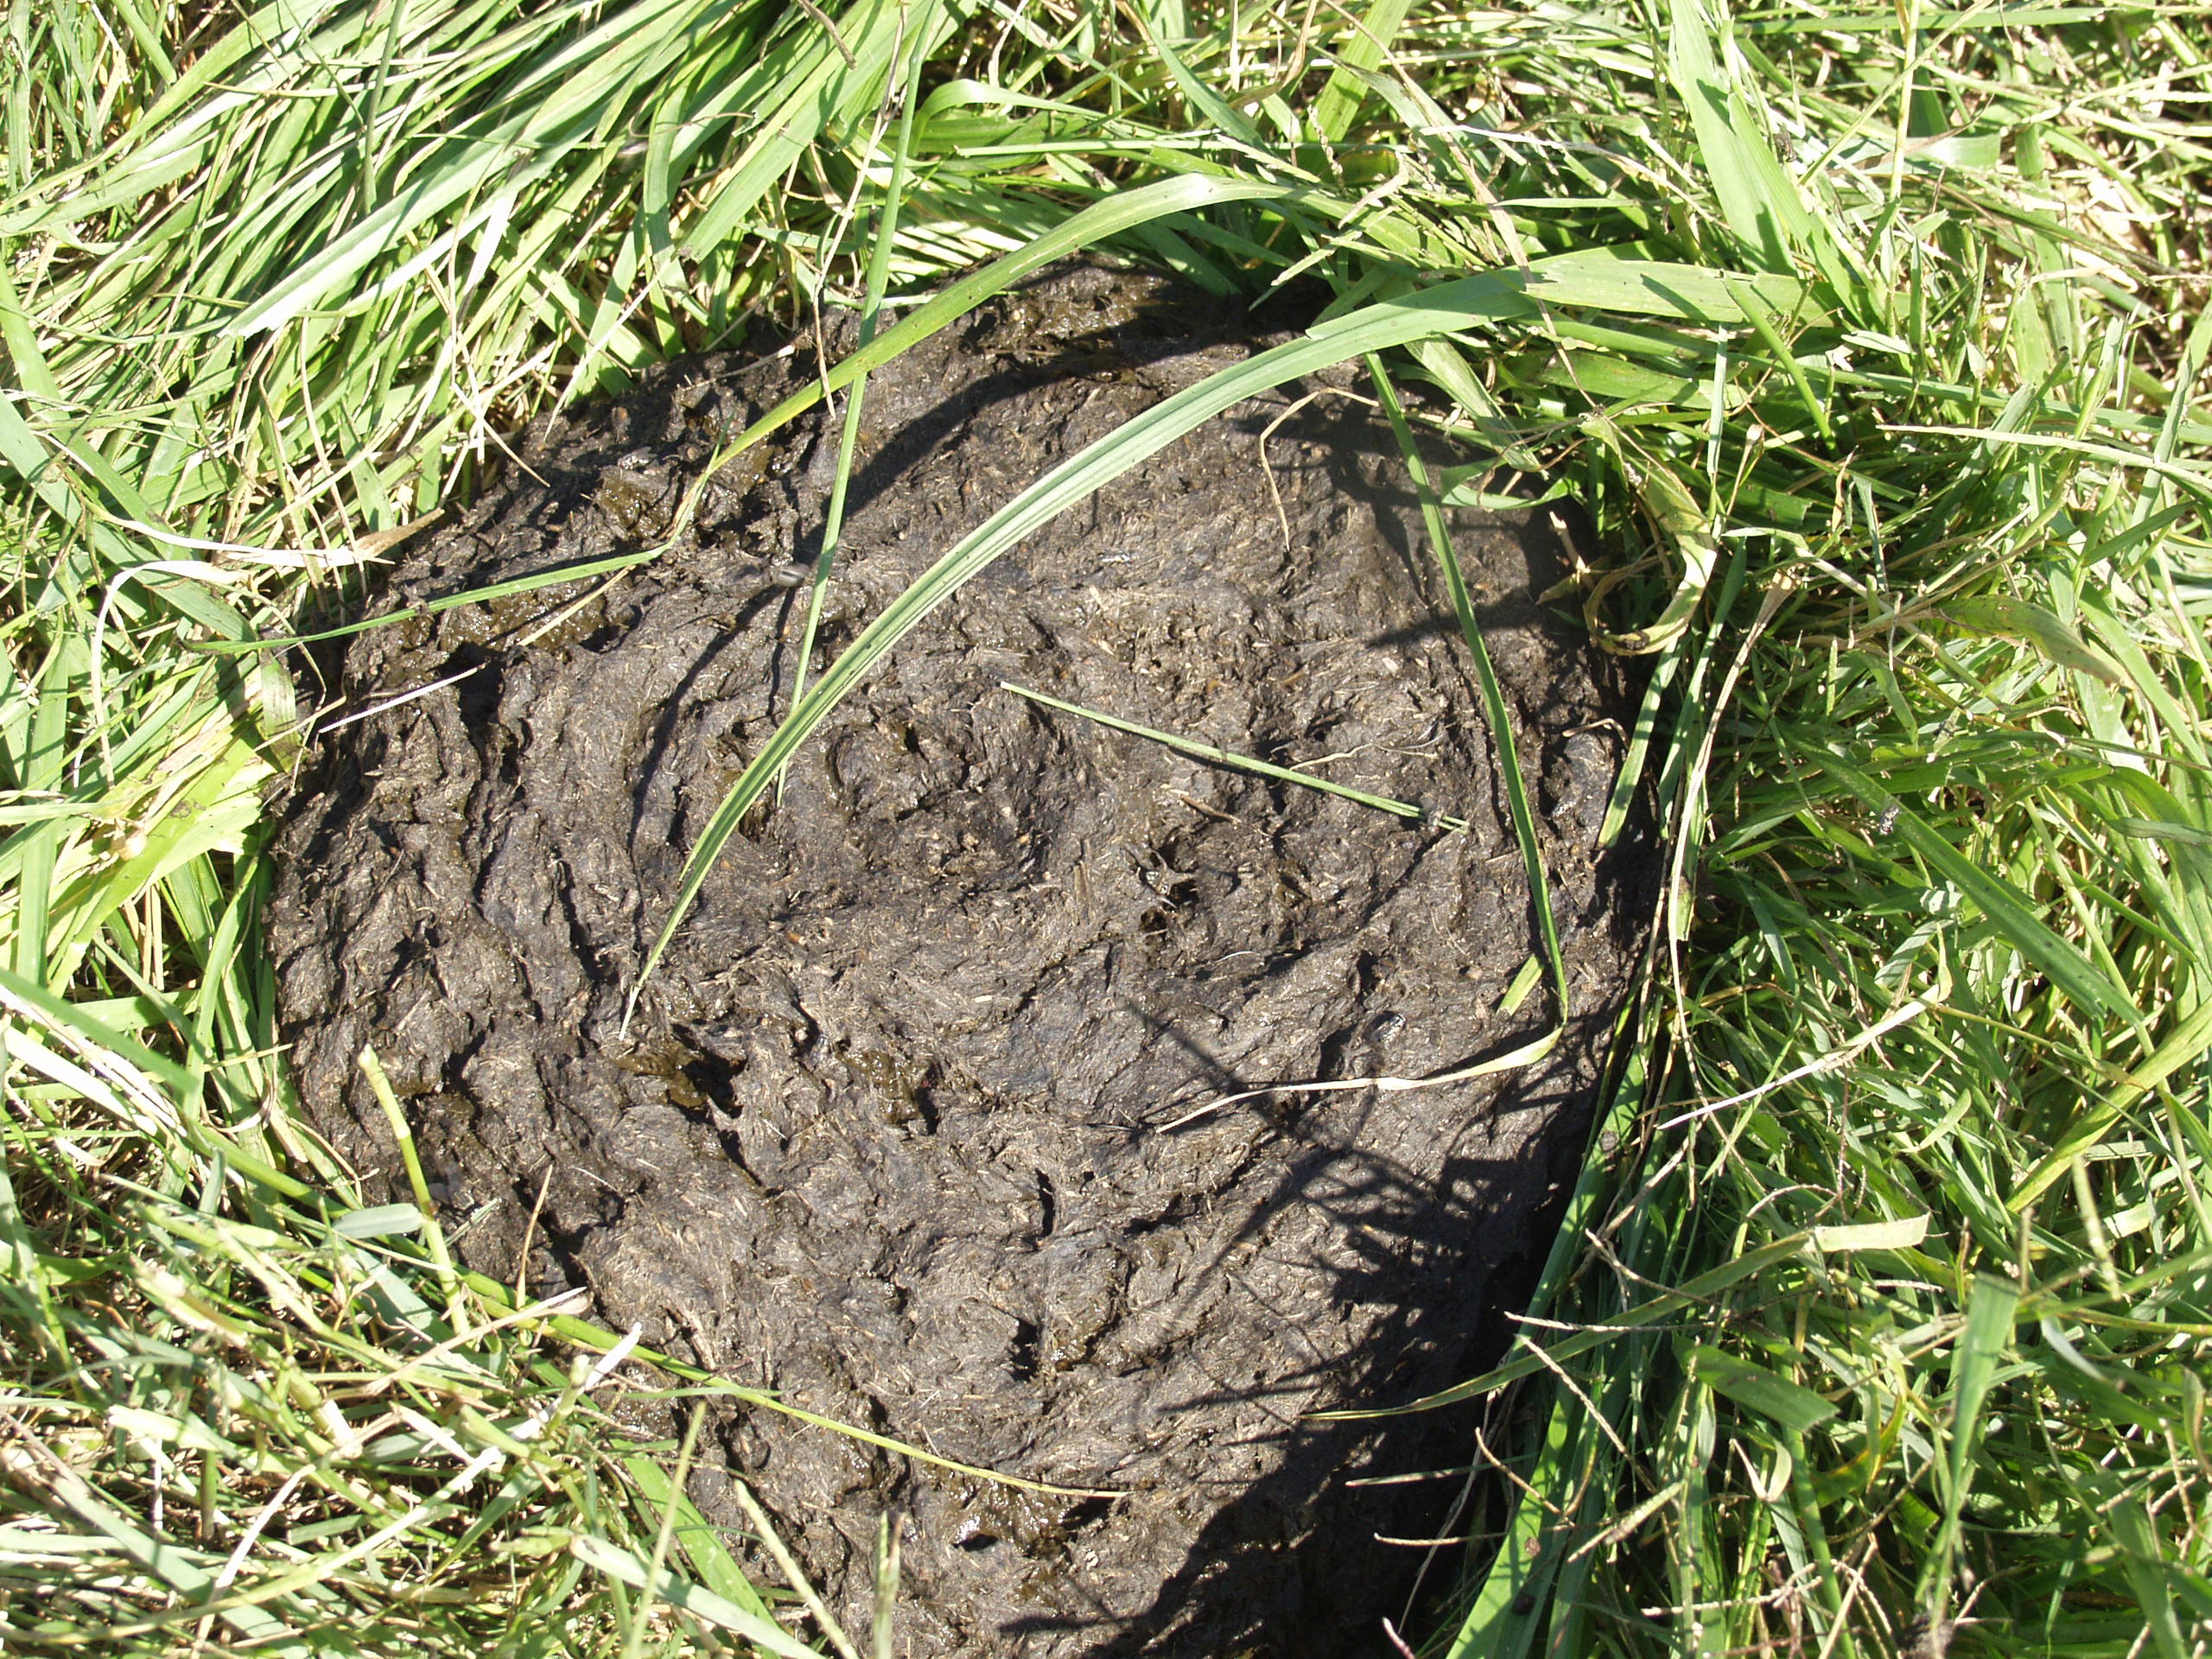
MDF Virtual Farm walk- Manure assessment
MDF Virtual farm walk New spinner cuts
MDF report Feb 10 2012
Macalister Demonstration Farm Update 286 (Week ending Feb 10, 2011)
The Macalister Demonstration Farm is milking 289 cows grazing 71 hectares, a stocking rate of 4.1 cows per hectare. Last year at this time, there were 285 milkers, and the stocking rate was 4.0 cows per hectare. The daily allocation for last week was one 30th of the grazing area, and the actual grazing rest time was 30 days.
Compared to last week, milk production per cow is up from 1.77 to 1.81 kg milk solids (MS) per cow per day. Litres per cow per day are up from 25.0 to 25.1. Milk fat test has risen from 3.67% to 3.71% (fat yield is up from 0.92 to 0.93 kg per cow per day). The protein test is up from 3.42% to 3.49% (protein yield is up from 0.86 to 0.88 kg per cow per day). This time last year, milk production was 21.5 litres, 1.63 kg MS, 0.89 kg fat, and 0.75 kg protein per cow per day. It is estimated that the cows are each gaining 0.1 kg live weight per day.
The daily pasture consumption from the grazing area is up from 36 to 37 kg dry matter (DM) per hectare per day. The pasture consumption per cow is up from 8.9 kg to 9.0 DM per cow per day. This time last year, pasture consumption was 39 kg DM per hectare per day, and 9.8 kg DM per cow per day.
4.0 mm of irrigation water, 1.2 kg of nitrogen element, no phosphorus, 0.05 kg of potassium, $0.19 of pasture renovation, and $0.30 of topping, all per hectare per day, have contributed to the current pasture consumption. The daily spend on these pasture inputs totals $4.76 per hectare per day, up from $4.56. Based on those cash inputs only, the consumed pasture price is estimated to be $130 per tonne of dry matter, down from $132.
Supplementary feed includes crushed wheat, and a pellet containing 25% protein, minerals, Rumensin, Tylan, and Zinc Oxide, totalling 7.6 kg DM per cow per day, at an average price of $329 per DM tonne, and 0.5 kg DM of Palm Kernal.
The Bulk Milk Cell Count has fallen from 117,000 to 99,000. This time last year the BMCC was 111,000.
The milk price (less compulsory levies) that the MDF anticipates receiving for the week’s milk is $5.35 per kg milk solids, or 38.5 cents per litre. Milk income per cow per day is up from $9.27 to $9.66, made up of $3.08 for the fat, $7.24 for the protein, and minus 0.66 for the litres. This time last year milk income per cow per day was $8.80.
Feed cost per cow per day (including pasture and supplements) are the same at $3.81 per cow per day, leaving a Margin over All Feed (MOAF) per cow of $5.85, up from $5.46. The margin over all feed per hectare is $23.82. The whole farm feed margin is $1,691, up from $1,578 per day. This time last year the whole farm feed margin was $1,585 per day.
The MDF has chosen the “traditional” system of milk payment. However, the other systems are always being examined to see if they might return a higher margin. Now that milk production from September to January is fixed, any farm that has selected the Domestic Incentive (DI) payment system knows how much milk is required, in the next five months, to meet the various levels of DI payment. A judgement and effort can be made to target a level. Leaving the chase too late may mean that milk per cow falls irretrievably, making targets impossible to achieve. Some farmers, who have chosen DI, have made their DI target more difficult by producing very well in the recent five months.
The DI milk price jumps up in stages: above 40% milk in the DI period gains about an extra 1 cent per litre; 41% about 2.3 cents; 42% about 3.5 cents; and 43% about 5 cents extra. 5 cents extra seems very attractive! By only just making into the next stage gets that price rise. If the next stage appears miles away, it may not be worth the chase.
Feeding more supplements per cow is an option to get more milk per cow to reach a higher DI level. Profitable feeding generally means supplying as much grass as possible, so for the next 5 months, fertiliser, irrigation and grazing management is crucial (isn’t it always?). After the best efforts at grass supply, if the herd can eat more, without wasting too much grass, give it to them.
Another way to get more milk is to milk more cows. Buying cows for a short period is probably extreme, but carefully choosing each cow’s drying off date, in June, and possibly reducing each cow’s normal dry period, is a method that will hold cow numbers higher.
Another manipulation in June could be to suddenly shorten the grazing rotation. This will supply more grass at the last minute. There are some short term/long term issues here. Reducing the cow’s dry period, and shortening the grazing rotation may mean lost milk or lost grass in July, mindful that July’s milk, and half of August’s, is in next season’s DI milk.
A DPI farm walk called “Recalibrating your electric fence post – using ETo for better irrigation decisions” will be held at the MDF today, Tuesday 14th February at 10am
Frank Tyndall 0409 940 782 ftyndall@ozemail.com.au


Macalister Demonstration Farm Update 286 (Week ending Feb 10, 2011)
The Macalister Demonstration Farm is milking 289 cows grazing 71 hectares, a stocking rate of 4.1 cows per hectare. Last year at this time, there were 285 milkers, and the stocking rate was 4.0 cows per hectare. The daily allocation for last week was one 30th of the grazing area, and the actual grazing rest time was 30 days.
Compared to last week, milk production per cow is up from 1.77 to 1.81 kg milk solids (MS) per cow per day. Litres per cow per day are up from 25.0 to 25.1. Milk fat test has risen from 3.67% to 3.71% (fat yield is up from 0.92 to 0.93 kg per cow per day). The protein test is up from 3.42% to 3.49% (protein yield is up from 0.86 to 0.88 kg per cow per day). This time last year, milk production was 21.5 litres, 1.63 kg MS, 0.89 kg fat, and 0.75 kg protein per cow per day. It is estimated that the cows are each gaining 0.1 kg live weight per day.
The daily pasture consumption from the grazing area is up from 36 to 37 kg dry matter (DM) per hectare per day. The pasture consumption per cow is up from 8.9 kg to 9.0 DM per cow per day. This time last year, pasture consumption was 39 kg DM per hectare per day, and 9.8 kg DM per cow per day.
4.0 mm of irrigation water, 1.2 kg of nitrogen element, no phosphorus, 0.05 kg of potassium, $0.19 of pasture renovation, and $0.30 of topping, all per hectare per day, have contributed to the current pasture consumption. The daily spend on these pasture inputs totals $4.76 per hectare per day, up from $4.56. Based on those cash inputs only, the consumed pasture price is estimated to be $130 per tonne of dry matter, down from $132.
Supplementary feed includes crushed wheat, and a pellet containing 25% protein, minerals, Rumensin, Tylan, and Zinc Oxide, totalling 7.6 kg DM per cow per day, at an average price of $329 per DM tonne, and 0.5 kg DM of Palm Kernal.
The Bulk Milk Cell Count has fallen from 117,000 to 99,000. This time last year the BMCC was 111,000.
The milk price (less compulsory levies) that the MDF anticipates receiving for the week’s milk is $5.35 per kg milk solids, or 38.5 cents per litre. Milk income per cow per day is up from $9.27 to $9.66, made up of $3.08 for the fat, $7.24 for the protein, and minus 0.66 for the litres. This time last year milk income per cow per day was $8.80.
Feed cost per cow per day (including pasture and supplements) are the same at $3.81 per cow per day, leaving a Margin over All Feed (MOAF) per cow of $5.85, up from $5.46. The margin over all feed per hectare is $23.82. The whole farm feed margin is $1,691, up from $1,578 per day. This time last year the whole farm feed margin was $1,585 per day.
The MDF has chosen the “traditional” system of milk payment. However, the other systems are always being examined to see if they might return a higher margin. Now that milk production from September to January is fixed, any farm that has selected the Domestic Incentive (DI) payment system knows how much milk is required, in the next five months, to meet the various levels of DI payment. A judgement and effort can be made to target a level. Leaving the chase too late may mean that milk per cow falls irretrievably, making targets impossible to achieve. Some farmers, who have chosen DI, have made their DI target more difficult by producing very well in the recent five months.
The DI milk price jumps up in stages: above 40% milk in the DI period gains about an extra 1 cent per litre; 41% about 2.3 cents; 42% about 3.5 cents; and 43% about 5 cents extra. 5 cents extra seems very attractive! By only just making into the next stage gets that price rise. If the next stage appears miles away, it may not be worth the chase.
Feeding more supplements per cow is an option to get more milk per cow to reach a higher DI level. Profitable feeding generally means supplying as much grass as possible, so for the next 5 months, fertiliser, irrigation and grazing management is crucial (isn’t it always?). After the best efforts at grass supply, if the herd can eat more, without wasting too much grass, give it to them.
Another way to get more milk is to milk more cows. Buying cows for a short period is probably extreme, but carefully choosing each cow’s drying off date, in June, and possibly reducing each cow’s normal dry period, is a method that will hold cow numbers higher.
Another manipulation in June could be to suddenly shorten the grazing rotation. This will supply more grass at the last minute. There are some short term/long term issues here. Reducing the cow’s dry period, and shortening the grazing rotation may mean lost milk or lost grass in July, mindful that July’s milk, and half of August’s, is in next season’s DI milk.
A DPI farm walk called “Recalibrating your electric fence post – using ETo for better irrigation decisions” will be held at the MDF today, Tuesday 14th February at 10am
Frank Tyndall 0409 940 782 ftyndall@ozemail.com.auw
Macalister Demo Farm Update Feb 3, 2011
Macalister Demonstration Farm, Dairy Australia, Extension Project
Projects on the farm are funded by Dairy Australia, the Gardiner Foundation, Sustainability Victoria, DPI VIC, Department of Agriculture Food and Fisheries, with support provided by GippsDairy.
Macalister Demonstration Farm Update 285 (Week ending Feb 3, 2011)
The Macalister Demonstration Farm is milking 289 cows grazing 71 hectares, a stocking rate of 4.1 cows per hectare. Last year at this time, there were 289 milkers, and the stocking rate was 4.0 cows per hectare. The daily allocation for last week was one 30th of the grazing area, and the actual grazing rest time was 30 days.
Compared to last week, milk production per cow is the same at 1.77 kg milk solids (MS) per cow per day. Litres per cow per day are down from 25.1 to 25.0. Milk fat test has fallen from 3.70% to 3.67% (fat yield is down from 0.93 to 0.92 kg per cow per day). The protein test is up from 3.38% to 3.42% (protein yield is up from 0.85 to 0.86 kg per cow per day). This time last year, milk production was 21.7 litres, 1.62 kg MS, 0.90 kg fat, and 0.72 kg protein per cow per day. It is estimated that the cows are each gaining 0.1 kg live weight per day.
The daily pasture consumption from the grazing area is down from 39 to 37 kg dry matter (DM) per hectare per day. The pasture consumption per cow is down from 9.4 kg to 9.1 DM per cow per day. This time last year, pasture consumption was 39 kg DM per hectare per day, and 9.8 kg DM per cow per day.
4.0 mm of irrigation water, 1.2 kg of nitrogen element, no phosphorus, 0.05 kg of potassium, $0.19 of pasture renovation, and $0.30 of topping, all per hectare per day, have contributed to the current pasture consumption. The daily spend on these pasture inputs totals $4.76 per hectare per day, up from $4.56. Based on those cash inputs only, the consumed pasture price is estimated to be $129 per tonne of dry matter, up from $118.
Supplementary feed includes crushed wheat, and a pellet containing 25% protein, minerals, Rumensin, Tylan, and Zinc Oxide, totalling 7.6 kg DM per cow per day, at an average price of $329 per DM tonne, and 0.5 kg DM of Palm Kernal.
The Bulk Milk Cell Count has risen from 85,000 to 117,000. This time last year the BMCC was 139,000. The BMCC average for the ten day period to 31/01/2012 was 94,000, which gave the farm a factory ranking of 8th out of 377 farms
Our milk company announced a price step-up during the week. The milk price (less compulsory levies) that the MDF anticipates receiving for the week’s milk is $5.23 per kg milk solids, or 37.1 cents per litre. Milk income per cow per day is up from $9.10 to $9.27, made up of $2.98 for the fat, $6.95 for the protein, and minus 0.65 for the litres. This time last year milk income per cow per day was $8.53.
Feed cost per cow per day (including pasture and supplements) is up from $3.58 to $3.81 per cow per day, leaving a Margin over All Feed (MOAF) per cow of $5.46, down from $5.53. The margin over all feed per hectare is $22.22. The whole farm feed margin is $1,578, down from $1,601 per day. This time last year the whole farm feed margin was $1,492 per day.
Applications for the MDF Travel and Learning Scholarship ($10,000) close on February 21st.
Frank Tyndall 0409 940 782 ftyndall@ozemail.com.au


QUOTING MILK PRICE
Currently, milk is mostly quoted as “dollars per kg of milks solids” (MS) or “cents per litre”. Some of us oldies still like “dollars per kg of fat”. When we were being paid for the fat only, “dollars per kg of fat” was fine, because more fat produced always meant more money received. Now that two components of milk, fat and protein, are paid for, and one component of milk, the litre volume, is charged for, a fat price alone, a litre price alone, or even a milk solids price alone, all send a distorted message on how one might get more money for an amount of milk. It is possible to sell more milk solids, by having a lot more fat and a lot less protein, and receive less money. It is possible to sell more litres, with a lower fat and protein test, and receive less money.
The most accurate, although cumbersome, method to quote milk price, is to quote all three component prices at the same time. So the MDF is currently receiving an announced milk price, with compulsory levies deducted, of $2.96 for a kg of fat, $7.42 for a kg protein, and minus $0.026 for a litre.
Macalister Demo Farm Report-27th Jan 2012
Macalister Demonstration Farm, Dairy Australia, Extension Project
Projects on the farm are funded by Dairy Australia, the Gardiner Foundation, Sustainability Victoria, DPI VIC, Department of Agriculture Food and Fisheries, with support provided by GippsDairy.
Macalister Demonstration Farm Update 284 (Week ending Jan 27, 2011)
The Macalister Demonstration Farm is milking 290 cows grazing 70 hectares, a stocking rate of 4.1 cows per hectare. Last year at this time, there were 292 milkers, and the stocking rate was 4.1 cows per hectare. The daily allocation for last week was one 30th of the grazing area, and the actual grazing rest time was 29 days.
Compared to last week, milk production per cow is down from 1.83 to 1.77 kg milk solids (MS) per cow per day. Litres per cow per day are down from 25.6 to 25.1. Milk fat test has fallen from 3.75% to 3.70% (fat yield is down from 0.96 to 0.93 kg per cow per day). The protein test is the same at 3.38% (protein yield is down from 0.87 to 0.85 kg per cow per day). This time last year, milk production was 23.4 litres, 1.74 kg MS, 0.95 kg fat, and 0.79 kg protein per cow per day. It is estimated that the cows are each gaining 0.1 kg live weight per day.
The daily pasture consumption from the grazing area is down from 42 to 39 kg dry matter (DM) per hectare per day. The pasture consumption per cow is down from 10.2 kg to 9.4 DM per cow per day. This time last year, pasture consumption was 42 kg DM per hectare per day, and 10.5 kg DM per cow per day.
1.2 kg nitrogen element, 0.02 kg potassium, no phosphorus, 3.9 mm irrigation water per hectare per day, some topping, and $0.19 of pasture renovation, all per hectare per day, have contributed to the current pasture consumption. The daily spend on these pasture inputs is $4.56 per hectare per day, up from $4.22. Based on those cash inputs only, the consumed pasture price is estimated to be $118 per tonne of dry matter, up from $100.
Supplementary concentrates include crushed wheat, and a wheat-canola-mineral mix totalling 7.2 kg DM per cow per day, at an average price of $323 per DM tonne, and 0.6 kg DM of Palm Kernal.
The Bulk Milk Cell Count has risen from 82,000 to 85,000. This time last year the BMCC was 110,000. The BMCC average for the ten day period ending 20/01/2012 was 86,000, which gave the farm a factory ranking of 6th out of 378 farms.
The milk price (less compulsory levies) that the MDF anticipates receiving for the week’s milk is $5.13 per kg milk solids, or 36.3 cents per litre. Milk income per cow per day is down from $9.35 to $9.10, made down of $2.97 for the fat, $6.79 for the protein, and minus 0.66 for the litres. This time last year milk income per cow per day was $9.05.
Currently, milk is mostly quoted as “dollars per kg of milks solids” (MS) or “cents per litre”. Some of us oldies still like “dollars per kg of fat”. When we were being paid for the fat only, “dollars per kg of fat” was fine, because more fat produced always meant more money received. Now that two components of milk, fat and protein, are paid for, and one component of milk, the litre volume, is charged for, a fat price alone, a litre price alone, or even a milk solids price alone, all send a distorted message on how one might get more money for an amount of milk. It is possible to sell more milk solids, by having a lot more fat and a lot less protein, and receive less money. It is possible to sell more litres, with a lower fat and protein test, and receive less money.
The most accurate, although cumbersome, method to quote milk price, is to quote all three component prices at the same time. So the MDF is currently receiving an announced milk price, with compulsory levies deducted, of $2.96 for a kg of fat, $7.42 for a kg protein, and minus $0.026 for a litre.
Feed cost per cow per day (including pasture and supplements) is up from $3.22 to $3.59 per cow per day, leaving a Margin over All Feed (MOAF) per cow of $5.51, down from $6.13. The margin over all feed per hectare is $22.67. The whole farm feed margin is $1,596, down from $1,778 per day. This time last year the whole farm feed margin was $1,706 per day.
Frank Tyndall 0409 940 782 ftyndall@ozemail.com.au


|
WEEKLY FEEDING PERFORMANCE |
Last Year |
Last week |
This week |
Units |
|
Week to date: |
28-Jan |
20-Jan |
27-Jan |
|
|
Milker graze area |
72 |
70 |
70 |
ha |
|
Milker nos |
292 |
290 |
290 |
head |
|
Stocking rate |
4.1 |
4.1 |
4.1 |
cows/ha |
|
Grazing allocation 1/ |
30 |
30 |
30 |
th of graze area |
|
Average graze rest time |
30 |
30 |
29 |
days |
|
Element N/hectare/day |
1.4 |
1.2 |
1.2 |
kg element/ha/day |
|
mm irrigation/hectare/day |
3.0 |
3.5 |
3.9 |
mm water/ha/day |
|
Estm’d pasture consmp’n (incl cons’vd forage) |
42 |
42 |
39 |
kg DM/ha/dy |
|
Pasture consum’d per cow |
10.5 |
10.2 |
9.4 |
kg DM/cow/dy |
|
Daily spend / milking ha |
$3.82 |
$4.22 |
$4.56 |
$/ha/day |
|
Estm’d pasture price |
$90 |
$100 |
$118 |
$/T DM |
|
Conc (incl additives)supp fed/cow |
6.7 |
6.7 |
7.2 |
kg DM/cow/dy |
|
Hay/silage supp fed/cow |
0.0 |
0.0 |
0.0 |
kg DM/cow/dy |
|
PKE supp fed/cow |
0.0 |
0.5 |
0.5 |
kg DM/cow/dy |
|
Estim’d supp waste |
3% |
3% |
3% |
% |
|
Conc (incl additives)supp avg price |
$340 |
$306 |
$323 |
$/T DM |
|
Hay/silage supp avg price |
$0 |
$0 |
$0 |
$/T DM |
|
PKE supp price |
$0 |
$289 |
$289 |
$/T DM |
|
Total feed intake/cow |
16.9 |
17.2 |
16.9 |
kg DM/cow/dy |
|
Estm’d body condt’n change |
0.10 |
0.10 |
0.10 |
kg LWT/cow/dy |
|
Litres/cow |
23.4 |
25.6 |
25.1 |
l/cow/day |
|
Fat test |
4.08% |
3.75% |
3.70% |
% |
|
Protein test |
3.37% |
3.38% |
3.38% |
% |
|
Fat per cow |
0.953 |
0.960 |
0.927 |
kg/cow/dy |
|
Protein per cow |
0.787 |
0.866 |
0.847 |
kg/cow/dy |
|
MS per cow |
1.74 |
1.83 |
1.77 |
kg/cow/dy |
|
Anticipated final milk price (less levies) |
$5.20 |
$5.12 |
$5.13 |
$/kg MS |
|
Anticipated final milk price (/litre) |
$0.387 |
$0.365 |
$0.363 |
$ per litre |
|
Fat return per cow |
$3.15 |
$3.08 |
$2.97 |
$/cow/dy |
|
Protein return per cow |
$6.51 |
$6.94 |
$6.79 |
$/cow/dy |
|
Volume charge per cow |
$0.61 |
$0.67 |
$0.66 |
$/cow/dy |
|
Milk income/cow |
$9.05 |
$9.35 |
$9.10 |
$/cow/dy |
|
All feed cost/cow |
$3.20 |
$3.22 |
$3.59 |
$/cow/dy |
|
Margin over all Feed/cow |
$5.84 |
$6.13 |
$5.51 |
$/cow/dy |
|
MOAF /ha /day |
$23.70 |
$25.39 |
$22.67 |
$/ha/day |
|
Farm MOAF per DAY |
$1,706 |
$1,778 |
$1,596 |
$/day |
|
MOAF per month |
$52,048 |
$54,216 |
$48,674 |
$/month |
|
Energy density of diet |
11.9 |
12.1 |
12.1 |
MJ ME/kg DM |
|
Crude protein % of diet |
19.5% |
17.9% |
18.0% |
% CP |
|
NDF Fibre level of diet |
31.2% |
32.5% |
30.8% |
% NDF |
|
FCE kg MS per tonne DM food |
102 |
105 |
104 |
|
|
Tonne feed /day |
5.0 |
5.1 |
5.0 |
tonne DM /day |
|
Milk Return /tonne feed |
$528 |
$536 |
$531 |
$/tonne DM |
|
Average Price of feed |
$187 |
$185 |
$210 |
$/tonne DM |
|
Margin /tonne feed |
$341 |
$351 |
$322 |
$/tonne DM |
|
BMCC |
110 |
82 |
85 |
|
|
WEEKLY FEEDING PERFORMANCE |
Last Year |
Last week |
This week |
Units |
|
Week to date: |
28-Jan |
20-Jan |
27-Jan |
|
|
Milker graze area |
72 |
70 |
70 |
ha |
|
Milker nos |
292 |
290 |
290 |
head |
|
Stocking rate |
4.1 |
4.1 |
4.1 |
cows/ha |
|
Grazing allocation 1/ |
30 |
30 |
30 |
th of graze area |
|
Average graze rest time |
30 |
30 |
29 |
days |
|
Element N/hectare/day |
1.4 |
1.2 |
1.2 |
kg element/ha/day |
|
mm irrigation/hectare/day |
3.0 |
3.5 |
3.9 |
mm water/ha/day |
|
Estm’d pasture consmp’n (incl cons’vd forage) |
42 |
42 |
39 |
kg DM/ha/dy |
|
Pasture consum’d per cow |
10.5 |
10.2 |
9.4 |
kg DM/cow/dy |
|
Daily spend / milking ha |
$3.82 |
$4.22 |
$4.56 |
$/ha/day |
|
Estm’d pasture price |
$90 |
$100 |
$118 |
$/T DM |
|
Conc (incl additives)supp fed/cow |
6.7 |
6.7 |
7.2 |
kg DM/cow/dy |
|
Hay/silage supp fed/cow |
0.0 |
0.0 |
0.0 |
kg DM/cow/dy |
|
PKE supp fed/cow |
0.0 |
0.5 |
0.5 |
kg DM/cow/dy |
|
Estim’d supp waste |
3% |
3% |
3% |
% |
|
Conc (incl additives)supp avg price |
$340 |
$306 |
$323 |
$/T DM |
|
Hay/silage supp avg price |
$0 |
$0 |
$0 |
$/T DM |
|
PKE supp price |
$0 |
$289 |
$289 |
$/T DM |
|
Total feed intake/cow |
16.9 |
17.2 |
16.9 |
kg DM/cow/dy |
|
Estm’d body condt’n change |
0.10 |
0.10 |
0.10 |
kg LWT/cow/dy |
|
Litres/cow |
23.4 |
25.6 |
25.1 |
l/cow/day |
|
Fat test |
4.08% |
3.75% |
3.70% |
% |
|
Protein test |
3.37% |
3.38% |
3.38% |
% |
|
Fat per cow |
0.953 |
0.960 |
0.927 |
kg/cow/dy |
|
Protein per cow |
0.787 |
0.866 |
0.847 |
kg/cow/dy |
|
MS per cow |
1.74 |
1.83 |
1.77 |
kg/cow/dy |
|
Anticipated final milk price (less levies) |
$5.20 |
$5.12 |
$5.13 |
$/kg MS |
|
Anticipated final milk price (/litre) |
$0.387 |
$0.365 |
$0.363 |
$ per litre |
|
Fat return per cow |
$3.15 |
$3.08 |
$2.97 |
$/cow/dy |
|
Protein return per cow |
$6.51 |
$6.94 |
$6.79 |
$/cow/dy |
|
Volume charge per cow |
$0.61 |
$0.67 |
$0.66 |
$/cow/dy |
|
Milk income/cow |
$9.05 |
$9.35 |
$9.10 |
$/cow/dy |
|
All feed cost/cow |
$3.20 |
$3.22 |
$3.59 |
$/cow/dy |
|
Margin over all Feed/cow |
$5.84 |
$6.13 |
$5.51 |
$/cow/dy |
|
MOAF /ha /day |
$23.70 |
$25.39 |
$22.67 |
$/ha/day |
|
Farm MOAF per DAY |
$1,706 |
$1,778 |
$1,596 |
$/day |
|
MOAF per month |
$52,048 |
$54,216 |
$48,674 |
$/month |
|
Energy density of diet |
11.9 |
12.1 |
12.1 |
MJ ME/kg DM |
|
Crude protein % of diet |
19.5% |
17.9% |
18.0% |
% CP |
|
NDF Fibre level of diet |
31.2% |
32.5% |
30.8% |
% NDF |
|
FCE kg MS per tonne DM food |
102 |
105 |
104 |
|
|
Tonne feed /day |
5.0 |
5.1 |
5.0 |
tonne DM /day |
|
Milk Return /tonne feed |
$528 |
$536 |
$531 |
$/tonne DM |
|
Average Price of feed |
$187 |
$185 |
$210 |
$/tonne DM |
|
Margin /tonne feed |
$341 |
$351 |
$322 |
$/tonne DM |
|
BMCC |
110 |
82 |
85 |
|